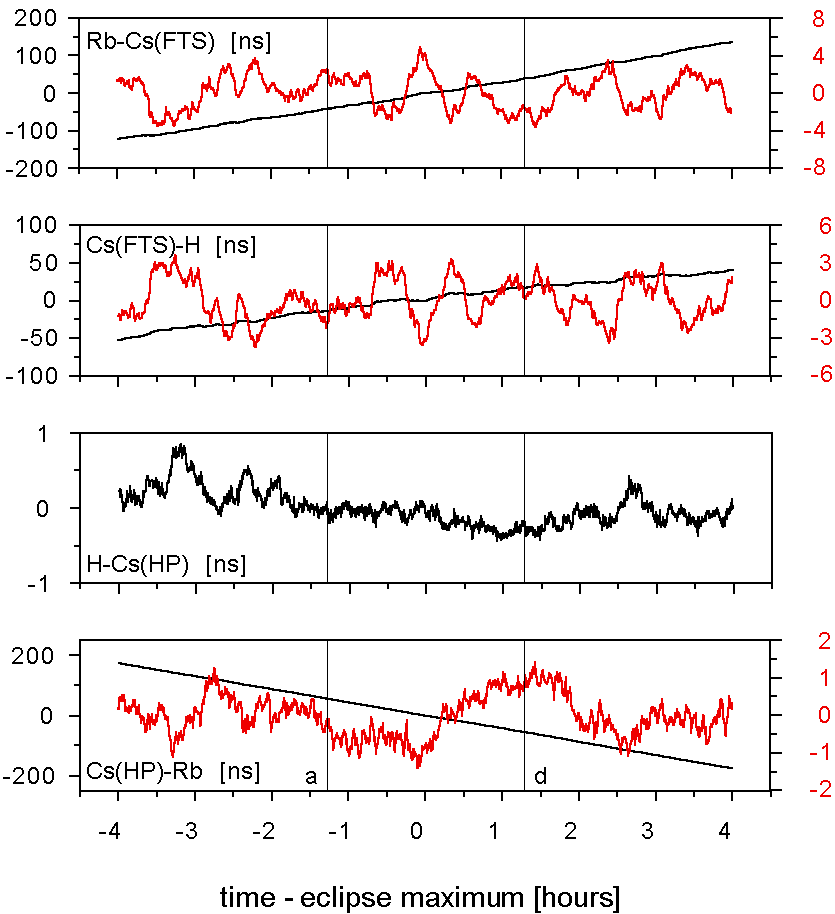
 Figure 2: The time
differences in ns of the 4 atomic clocks during the total eclipse observed
over a longer period. Different offsets have been subtracted from each
plot. The clearly visible drifts (black curves) have been removed as a
quadratic function to obtain the red curve for which the red tick marks
on the right side apply. The marks a and d label the beginning and the
end of the partial eclipse. The strong anticorrelation of trace A and B
shows that the Cs(FTS) clock dominates the noise at this time scale. H
and Cs(HP) are both very stable and agree very well so that no regular
drift could be identified.

