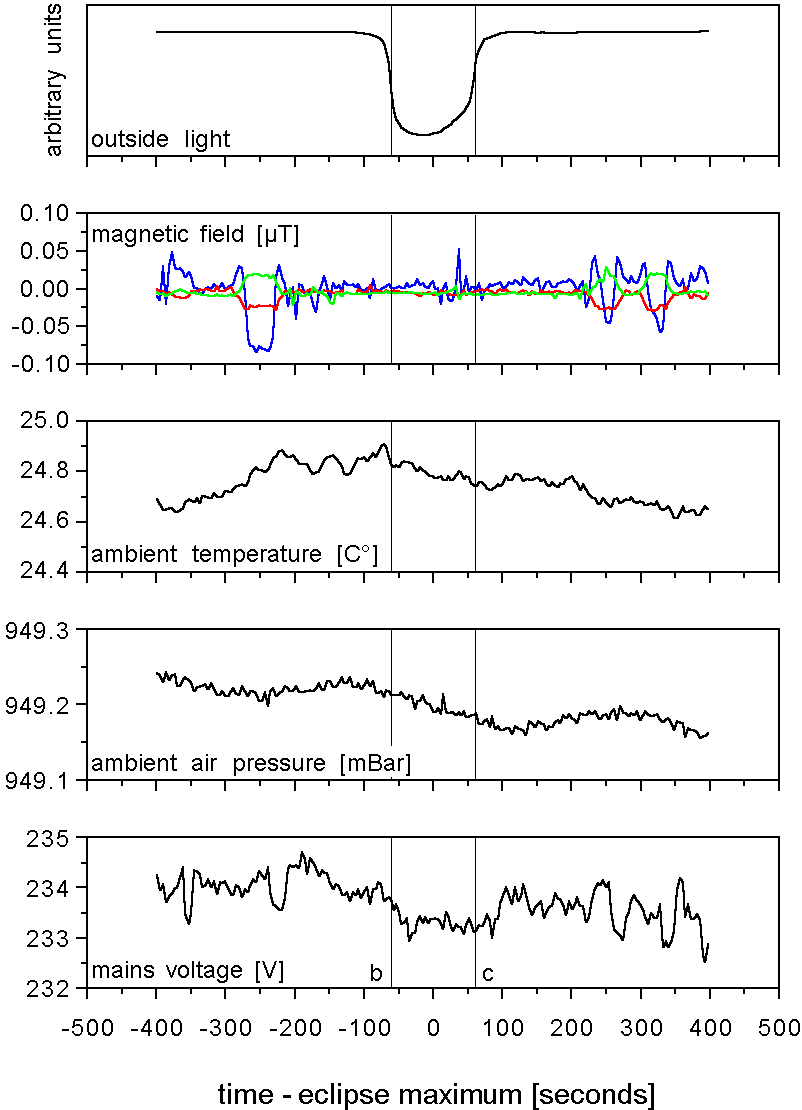
 Figure 2: Additional parameters
measured during the eclipse for the time window plotted in figure
1. From top to the bottom: outside light intensity in arbitrary units.
East, north and vertical magnetic field fluctuations (in µ
Tesla) shown in red, green and blue respectively (different constant
values have been removed). Ambient temperature. Ambient barometric pressure.
Mains voltage. The marks b and c label the beginning and the end of the
total eclipse.

